How to Financially Measure the Impact of Environmental Protection on Industrial Machinery
Financial Impact of Environmental Control
```Turn environmental failures, downtime, and premature wear into financial indicators that support maintenance and investment decisions.
```Most industries recognize that harsh environments affect machinery, equipment, electrical panels, and components. The most common mistake is treating the problem solely as a technical issue without considering its financial effects.
```When particles, oil mist, moisture, residue, or temperature variations accelerate wear, the impact translates into lower MTBF, higher MTTR, productivity losses, and greater exposure to operational and contractual risks.
- Identify the direct and indirect costs of downtime.
- Compare performance before and after technical intervention.
- Monitor reliability and maintenance indicators.
- Calculate the return on investment in environmental control.
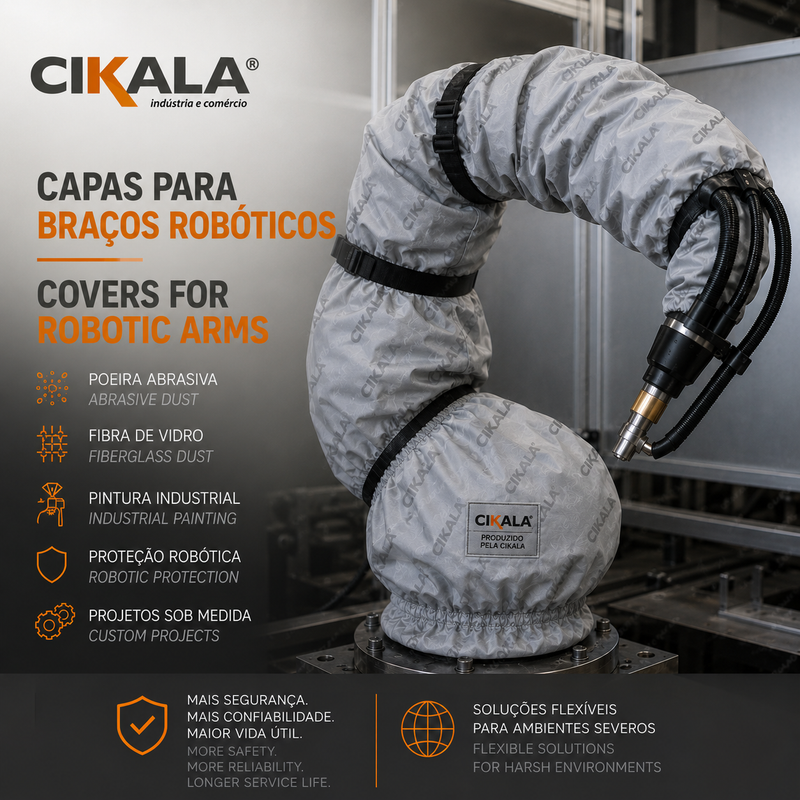
CIKALA develops protection solutions and custom projects for machinery installed in critical industrial environments.
Comparison Before and After Technical Protection
The first step in financially measuring an intervention is to compare equivalent operational indicators. The analyzed period should consider similar machinery, shifts, and production conditions.
The example below demonstrates how reducing failures can change the annual cost of a critical asset.
| Indicator | Without Protection | With Technical Protection |
|---|---|---|
| MTBF | 1,500 hours | 3,800 hours |
| Unplanned downtime events per year | 8 | 2 |
| Average cost per downtime event | R$ 35,000 | R$ 35,000 |
| Estimated annual cost | R$ 280,000 | R$ 70,000 |
| Operational predictability | Low | High |
What the Comparison Reveals
- Longer mean time between failures.
- Fewer unplanned downtime events.
- Lower exposure to production losses.
- Greater predictability for maintenance and logistics.
In this illustrative scenario, the estimated annual savings are R$ 210,000. This amount can be used as a basis for evaluating the investment payback period.
Simplified Downtime Cost Model
The actual cost of a failure is not limited to corrective maintenance. It may also involve unproductive hours, lost revenue, material disposal, rework, logistics delays, and contractual penalties.
Reference Formula
Total annual cost = number of downtime events × downtime hours × machine cost per hour + maintenance + logistics and contractual impacts.
Practical Example
Consider an operation with six downtime events per year, an average duration of four hours, and a production cost of R$ 12,000 per hour.
6 downtime events × 4 hours × R$ 12,000 = R$ 288,000 per year.
If the number is reduced to two downtime events, the direct cost falls to R$ 96,000 per year.
- Estimated direct savings: R$ 192,000 per year.
- Lower need for emergency maintenance.
- Reduced risk of delivery delays.
- Greater stability for production planning.
To calculate the return, compare the estimated annual savings with the investment made in the technical protection solution.
Strategic KPIs for Monitoring Results
Continuous measurement makes it possible to verify whether the adopted solution is reducing failures, improving availability, and generating savings. Indicators should be recorded before and after implementation.
MTBF
Mean Time Between Failures shows how long the equipment operates before experiencing another failure.
MTTR
Mean Time to Repair indicates how long the team needs to restore the asset to operation.
Downtime Cost per Hour
Consolidates production losses, labor, materials, energy, logistics, and commercial commitments.
Environmental Failures
Measures the contribution of dust, liquids, mist, residue, and temperature to recorded failures.
Operational Predictability
Evaluates the ability to meet production plans without unexpected interruptions.
Cost per Critical Asset
Helps prioritize investments in equipment with the greatest financial and production impact.
Indicators become more valuable when associated with targets, comparable periods, and reliable maintenance and production records.
Regulatory References and Labor Implications
Environmental and operational risk management should be part of a company's preventive planning. Depending on the activity and application, the guidelines of NR 01, related to occupational risk management, and NR 12, focused on machinery and equipment safety, may be considered.
In environments with relevant physical, chemical, or biological agents, it may also be necessary to assess the applicability of NR 09 and, where appropriate, NR 15. The analysis should consider the current versions of the regulations and the specific conditions of each operation.
Potential Impacts of an Environmental Failure
- Accidents involving operators or maintenance teams.
- Inadequate exposure to agents present in the environment.
- Employee leave and operational interruptions.
- Administrative penalties and labor liabilities.
- Losses in quality, productivity, and reliability.
Technical protection, control, and isolation measures help mitigate risks and should be part of a broader safety, maintenance, and operational management strategy.
How to Evaluate Return on Investment
Proper environmental protection should be evaluated as a risk mitigation investment rather than simply as an additional expense. The return can be calculated based on the reduction in annual costs associated with failures, downtime, and maintenance.
Before implementation, record failure frequency, average downtime, production cost per hour, and maintenance expenses. Then repeat the measurement over an equivalent period after implementation and compare the results.
Estimated ROI = [(savings generated − investment) ÷ investment] × 100.
CIKALA develops solutions adapted to environmental conditions, machine dimensions, and access, ventilation, operation, and maintenance requirements.
Reduce downtime, protect critical assets, and increase operational predictability with solutions from CIKALA. For technical applications or specific environments, send your project details, approximate dimensions, company registration information, and a brief description of your requirements to vendas@cikala.com.br or contact the custom projects channel.
CIKALA solves it.
Frequently Asked Questions
How do you calculate the cost of industrial downtime?
Multiply the number of downtime events by the hours of interruption and the production cost per hour. Then add maintenance, rework, discarded materials, logistics, and any contractual impacts.
How do you measure the return on environmental protection?
Compare the annual costs of failures and downtime before and after implementation. The savings generated can be compared with the amount invested to calculate ROI and the payback period.
Which indicators should be monitored?
The main indicators are MTBF, MTTR, downtime cost per hour, number of environmental failures, asset availability, and maintenance cost per piece of equipment.
When is a custom project necessary?
A custom project is recommended when there are specific dimensions, frequent access requirements, machine movement, ventilation needs, space restrictions, or intense exposure to particles, liquids, and other agents.
Where to Find CIKALA
Check the company's location and plan your contact with the team.
Discover CIKALA
Watch the corporate video and learn about the company's structure and the solutions developed for different industrial applications.

